Introduction
In this lesson, you will learn about slopes and how to use graphs to visualize them. Graphs help you recognize patterns in data and are useful in almost every industry.
This video illustrates the lesson material below. Watching the video is optional.
Slope
A slope is a visual representation of the rate of change of a function on a graph. Slope represents the steepness of a line.
- Slope: The rate of change of a function on a graph; the steepness of the line.
Example 1
In the following example, there are two lines. Both lines are going in the same direction. They start in the bottom left corner of the graph and move to the top right corner of the graph.

Figure 1
One of the lines in Figure 1 is much steeper than the other. This means that this line has a much greater slope. You could also say that the rate at which the steeper line is changing is much greater than the less steep line. Rate of change merely refers to the steepness of the line.
Suppose these lines in Figure 1 above and Figure 2 below represent the side of a mountain. The steeper line would be much more difficult to climb. The second line, or the less steep line, would be much easier to climb. The third line, its rate of change, its slope, or its steepness is much less than the other two. Again, if it was a mountain, it would be much easier to climb then the other two lines. These lines (moving from the bottom-left to the top-right) represent a positive slope.
Lines with positive slopes start at the bottom left corner and increase to the top right corner. As the x-values move in the positive direction, the y-values also move in the positive direction.

Figure 2
Notice, if you were to read the graph from the left to the right, the x - values move in a positive direction, and the y-values move in a positive direction as well. Positive slope can be determined by unity of direction.
Example 2
Consider another set of lines (see Figure 3 & Figure 4). These lines move in a different direction than those in Figure 1 and 2. They start at the top left and decrease down toward the bottom right.

Figure 3
These lines have a negative slope. When a line has a negative slope, the x-value increases as the y-value decreases; similarly, as the x-value decreases, the y-value increases.

Figure 4
To determine if the slope is positive or negative: Follow the line from left to right. If the graph goes up, its slope is positive. If the graph goes down, its slope is negative.
Things to Remember
- Positive slope can be determined by unity of direction. The slope is positive if:
- the x and y -values are both going in the same positive or negative direction.
- the line graph increases from left to right.
- Negative slope can be determined if:
- the x and y-values are going in opposite directions.
- the line moves toward the negative side of the x-axis and the positive side of the y-axis.
- the line graph decreases from left to right.
- Positive slope can be compared to climbing up a mountain. Negative slope can be compared to climbing down a mountain.
- The steeper the line, the greater the slope, or the rate of change.
Practice Problems
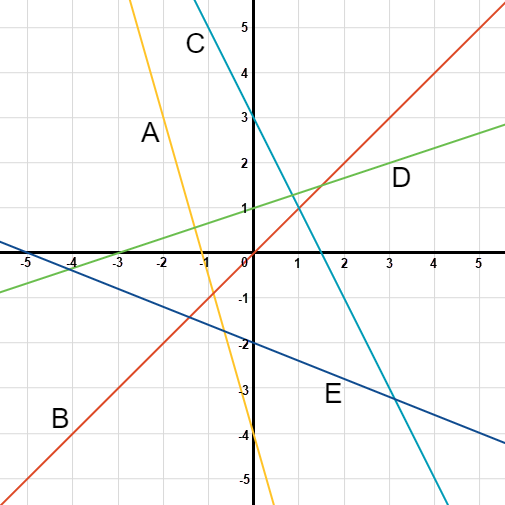
Use the graph below to answer questions 1 through 5.
- Is the slope of line A positive or negative? (
- Positive
- Negative
- Is the slope of line B positive or negative? (
- Positive
- Negative
- Is the slope of line C positive or negative? (
- Positive
- Negative
- Is the slope of line D positive or negative? (
- Positive
- Negative
- Is the slope of line E positive or negative? (
- Positive
- Negative

