
Introduction
In this lesson, you will find the value of the slope of any line. Slope is usually represented by the variable m. You will also review the meaning of a slope of zero and an undefined slope.
These videos illustrate the lesson material below. Watching the videos is optional.
- The Value of the Slope of a Line (08:42 mins) | Transcript
- Zero and Undefined Slope (02:24 mins) | Transcript
The Value of the Slope of a Line
What does slope mean? What is the slope of a line?
Example 1
Imagine that the line in Figure 1 represents a staircase. You need to calculate the slope of this staircase, or how steep the staircase is, by comparing the height of each step to the width of each step.
Use a fraction to perform this comparison. The height of each step is the rise of the step, and the width of each step is the run. Calculate the slope by dividing the rise by the run, or \(\frac{rise}{run}\). Here are several ways to think about slope:
\begin{align*} Slope = \frac{rise}{run} = \frac{change\;in\;Y}{change\;in\;X} = \frac{amount\;Y\;value\;changes}{amount\;X\;value\; changes}\end{align*}
To calculate the slope of the staircase, look at one step and see that the rise of one step is equal to 1 unit on the y-axis, so the rise is 1. The run is also 1 unit.
Divide the rise by the run to find the slope.
\begin{align*} Slope = \frac{rise}{run} = \frac{1}{1} =1\end{align*}
This line has a slope of 1.

Figure 1
Example 2
What is the slope of the line in Figure 2?

Figure 2
First, draw a staircase for this line. Put the corners of the staircase on points where values of the x-axis are integers on the line. See Figure 3.

Figure 3
This step is steeper than the steps in Example 1. Instead of the rise going up one unit for every one unit of run, it goes up two units for every one unit of run:
\begin{align*} Slope = \frac{rise}{run} = \frac{2}{1} =2\end{align*}
The slope is 2, which demonstrates that the steeper the line is, the larger the slope.
Example 3
What is the slope of the line in Figure 4?

Figure 4
This slope is negative. A negative slope causes a line to angle down from the top left to the bottom right. Regardless of whether the slope is positive or negative, you can still use the staircase method to calculate it.

Figure 5
Notice that the steps are going down in the negative direction on this line. In this case, the rise for each step is one unit in the negative direction, or -1. The run is two steps or units in the positive direction, or 2.
Slope is usually defined with the variable m. For this line, this slope is:
\begin{align*} m = \frac{rise}{run} = \frac{-1}{2} \end{align*}
Example 4
What is the slope of the line in Figure 6?

Figure 6
This line doesn't have many integer coordinate intersections. There is one at (0,2), but in order to calculate slope, you will need another point. There appears to be another point at about (3,1.6) (see Figure 7).
Use these values to calculate the slope:
\begin{align*} m = \frac{rise}{run} = \frac{-0.4}{3}\end{align*}
Note that the rise is -0.4 because you are going down from 2 to 1.6. The run is 3 since you are moving to the right 3 units. Also remember that \(\frac{-0.4}{3}\) is the same as \(\frac{0.4}{-3}\).
Now, simplify the fraction:
\begin{align*} m = -\frac{-0.4}{3} = -0.13\end{align*}
The final estimated slope of this line is \(m=-0.13\).

Figure 7
Zero and Undefined Slope
Example 5
What is the slope of the horizontal line in Figure 8?
The horizontal line is flat. Use the same techniques in the section above to calculate the slope. If you take two points on the line and compare the rise and the run, you can find m (slope). The rise is 0. This line doesn’t go up or down at all. The run is 1:
\begin{align*} m = \frac{rise}{run} = \frac{0}{1} = 0\end{align*}
0 divided by anything is always 0, so a flat or horizontal line will always have a slope of 0, or \(m = 0\)

Figure 8
Example 6
What is the slope of the vertical line in Figure 9?
Follow the same steps as above. Start by picking two points. In this case, the rise is 1 unit, but the run is 0. The line does not run or move back or forth on the x-axis.
\begin{align*} m = \frac{rise}{run} = \frac{1}{0} = Undefined \end{align*}
You cannot divide anything by 0. Dividing by zero is undefined, which means it doesn’t make any sense in mathematics. You can also refer to the slope of any line with a run of 0 as undefined.

Figure 9
Things to Remember
- The equation for slope is \(m=\frac{rise}{run}\).
- m: the variable used for slope.
- Rise: how far up (or down) the step goes.
- Run: how far over (right or left) the step goes.
- A negative slope causes a line to angle down from the top left of a graph to the bottom right.
- A positive slope causes a line to angle up from bottom left of a graph to the top right.
- Always check to see if your slope should be positive or negative.
- Horizontal lines have a slope of 0.
- Vertical lines have an undefined slope.
Practice Problems
Use the following graph to answer questions 1 through 7.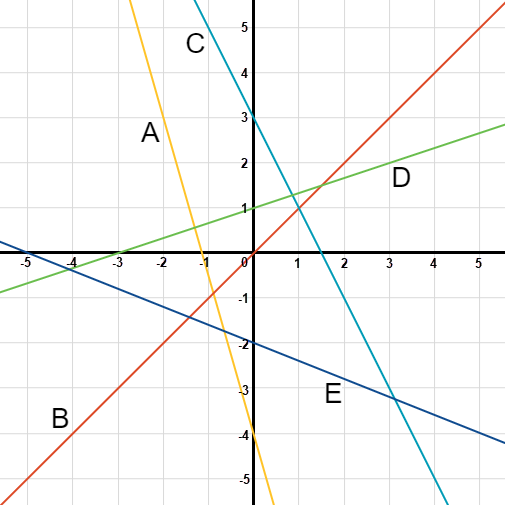
- What is the slope of line A? (
Details:
Step 1: Locate two points on the graph that will be used to find the slope. It is best to choose points with x and y values that are integers, if possible. For this example, choose \((−2,3)\) and \((0,−4)\).
Step 2: Draw a vertical line and a horizontal line to represent the ‘step’ between the two points:
Step 3: Find the rise (or change in y value) and the run (or change in x value).
Step 4: Find the slope. The slope is the change in y value (or how much the line went up or down between the two points) divided by the change in x value (or how much the step moves to the right). The slope is negative since it goes down when you follow the line from left to right. The slope is:
\({\text{m}}= \dfrac{\text{change in y}}{\text{change in x}}=-\dfrac{7}{2}\)
\({\text{m}}= -\dfrac{7}{2}\) - What is the slope of line B? (
- What is the slope of line C? (
- What is the slope of line D? (
- What is the slope of line E? (
- What is the slope of a horizontal line? (
- What is the slope of a vertical line? (
Details:
Step 1: Locate two points on the graph that will be used to find the slope. Since there isn't a graph of this line, draw a sample line and include two points so that you can find the slope:
Step 2: Draw a vertical line and a horizontal line to represent the ‘step’ between the two points. In this case, you can only draw a vertical line because there is no change in the x values:
Step 3: Find the rise (or change in y-value) and the run (or change in x-value). The rise, or change in y-value, is 2. There is no change in the x-value so the run is 0.
Step 4: Find the slope. The slope is the change in y-value (or how much the line went up or down between the two points) divided by the change in x-value (or how much the step moved to the right).
\({\text{m}}=\dfrac{\text{change in y}}{\text{change in x}}=\dfrac{2}{0}\)
So m = undefined because you can’t divide by zero.